概要
pprofの使い方の備忘録として何回かに分けて書いてきます。
今回は前提知識として知っておくべきことを書きます。
環境
- go 1.10.1
pprofは2つの計測方法がある
以下の2つのやり方があります。
- runtime/pprof が提供しているAPIを使ってファイルに出力する
- net/http/pprof を使ってプロファイル取得用の http サーバーを立てる
前者は短時間で実行が終了するようなケースで使います。
後者はWebサーバのようにずっと動かすプログラムのケースで使います。
手順
基本的な手順は以下です。
- コードにプロファイラを埋め込む
- プログラムを動かしている間にプロファイルの取得
- プロファイルの解析
runtime/pprofの場合
runtime/pprofを使いやすい形にラップしている以下のライブラリを使います。
デフォルトではCPU Profileが有効になっています。
Memory Profileなど指定したい場合は
defer profile.Start(profile.MemProfile).Stop()
のように指定します。他のオプションはドキュメントで確認できます。
ただしこのライブラリは一度に一種類のプロファイルしかできません。
CPUとメモリを同時に〜ということはできないので注意してください。
1. コードにプロファイラを埋め込む
CPUバウンドな関数であるフィボナッチ数を取得します。
30番目のフィボナッチ数を取得する関数をループで回します。
package main

import (
    "fmt"

    "github.com/pkg/profile"
)

func fib(n int) int {
    if n < 2 {
        return n
    }
    return fib(n-1) + fib(n-2)
}

func main() {
    defer profile.Start(profile.ProfilePath(".")).Stop()

    fmt.Println("start")
    for i := 0; i < 1000; i++ {
        fib(30)
    }
}
profileファイルがカレントフォルダに出力されるようにprofile.ProfilePath(".")を付けます。
2. プログラムを動かしてプロファイルの取得
$ ./main
2018/04/07 14:55:13 profile: cpu profiling enabled, cpu.pprof
start
2018/04/07 14:55:19 profile: cpu profiling disabled, cpu.pprof
cpu.pprofに出力されました。
3. プロファイルの解析
出力されたファイルを解析します。
$ go tool pprof 実行ファイル プロファイル
の順に書きます。
注意としてこの時の実行ファイル(バイナリ)はプロファイルした時のバイナリにしてください。本番のバイナリとローカル(Mac)のバイナリが違うせいでプロファイリングできない〜とならないように。
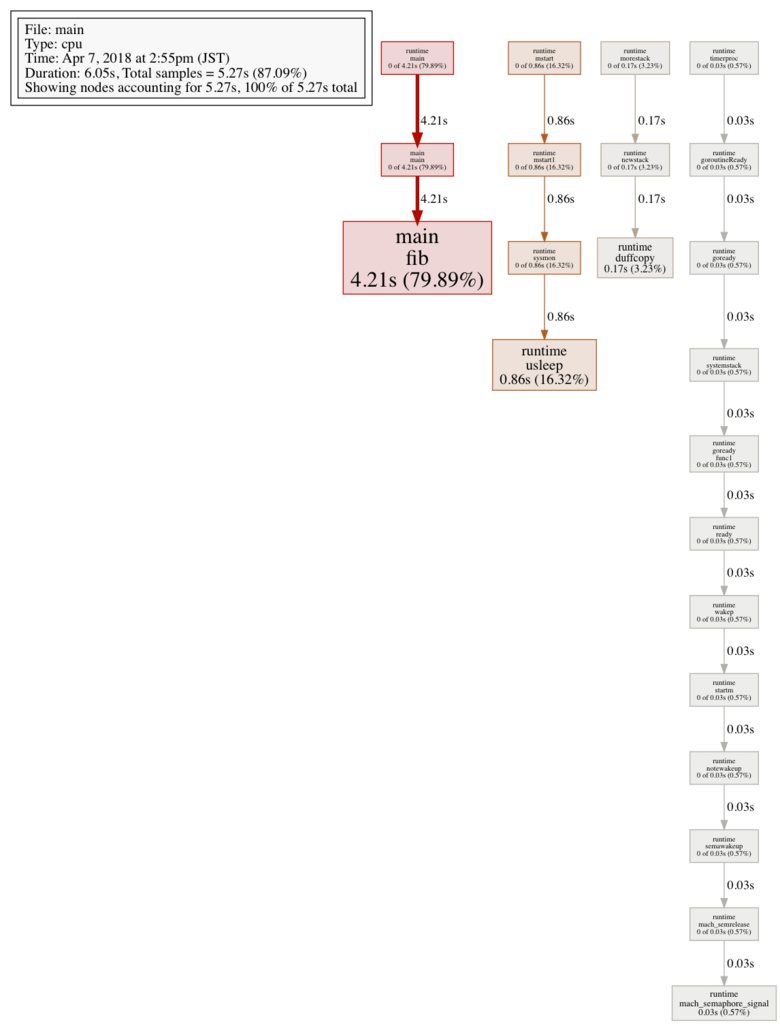
$ go tool pprof main cpu.pprof
File: main
Type: cpu
Time: Apr 7, 2018 at 2:55pm (JST)
Duration: 6.05s, Total samples = 5.27s (87.09%)
Entering interactive mode (type "help" for commands, "o" for options)
(pprof)
インタラクティブに解析していくので、topと入力すると結果を出してくれます。
(pprof) top
Showing nodes accounting for 5.27s, 100% of 5.27s total
Showing top 10 nodes out of 22
      flat  flat%   sum%        cum   cum%
     4.21s 79.89% 79.89%      4.21s 79.89%  main.fib
     0.86s 16.32% 96.20%      0.86s 16.32%  runtime.usleep
     0.17s  3.23% 99.43%      0.17s  3.23%  runtime.duffcopy
     0.03s  0.57%   100%      0.03s  0.57%  runtime.mach_semaphore_signal
         0     0%   100%      4.21s 79.89%  main.main
         0     0%   100%      0.03s  0.57%  runtime.goready
         0     0%   100%      0.03s  0.57%  runtime.goready.func1
         0     0%   100%      0.03s  0.57%  runtime.goroutineReady
         0     0%   100%      0.03s  0.57%  runtime.mach_semrelease
         0     0%   100%      4.21s 79.89%  runtime.main
フィボナッチ数の計算で時間がかかっていることがわかりますね。
net/http/pprofの場合
1. コードにプロファイラを埋め込む
localhost:6060にサーバを立てます。
import (
    "fmt"
    "log"
    "net/http"

    _ "net/http/pprof"
)

func fib(n int) int {
    if n < 2 {
        return n
    }
    return fib(n-1) + fib(n-2)
}

func main() {
    go func() {
        log.Println(http.ListenAndServe("localhost:6060", nil))
    }()

    fmt.Println("start")
    for {
        fib(30)
    }
}
2. プログラムを動かしている間にプロファイルの取得
curlで取得します。CPU profileは30秒かかります。
$ curl -s http://localhost:6060/debug/pprof/profile > cpu.pprof
3. プロファイルの解析
先程と同じなので割愛します。
ちなみにnet/http/pprofの場合、2と3をまとめて
$ go tool pprof http://localhost:6060/debug/pprof/profile
というやり方もできます。
その他
計測できる項目がたくさんある
先程はCPUプロファイルでしたが、他にもheapやらgoroutineやらを計測できます。
- http://localhost:6060/debug/pprof/goroutine
- http://localhost:6060/debug/pprof/heap
- http://localhost:6060/debug/pprof/threadcreate
- http://localhost:6060/debug/pprof/block
- http://localhost:6060/debug/pprof/mutex
- http://localhost:6060/debug/pprof/profile
- http://localhost:6060/debug/pprof/trace?seconds=5
注意としてデフォルトではONになっていなものもあるので、ドキュメントを見てから使いましょう。
僕が知っているのは以下です。
| 項目 | デフォルト |
|---|---|
| profile | ON |
| heap | ON |
| threadcreate | ON |
| goroutine | ON |
| block | OFF runtime.SetBlockProfileRateが必要 |
| mutex | OFF runtime.SetMutexProfileFractionが必要 |
| trace | ON |
グラフ化することができる
計測結果をグラフ化してどこにどれくらい時間・リソースがかかったかなどを見やすくすることもできます。
$ go tool pprof -png main out > out.png
WebUI
Go 1.11からは
も入り非常に見やすいWebUIが使えるようになってます。
使い方
graphvizが必要なのでインストールしてください。
$ brew install graphviz
WebUIの起動は
$ go tool pprof -http=[bind_addr] [binary] [profile]
というフォーマットです。
具体的に実行すると
$ go tool pprof -http=":8081" http://localhost:6060/debug/pprof/profile
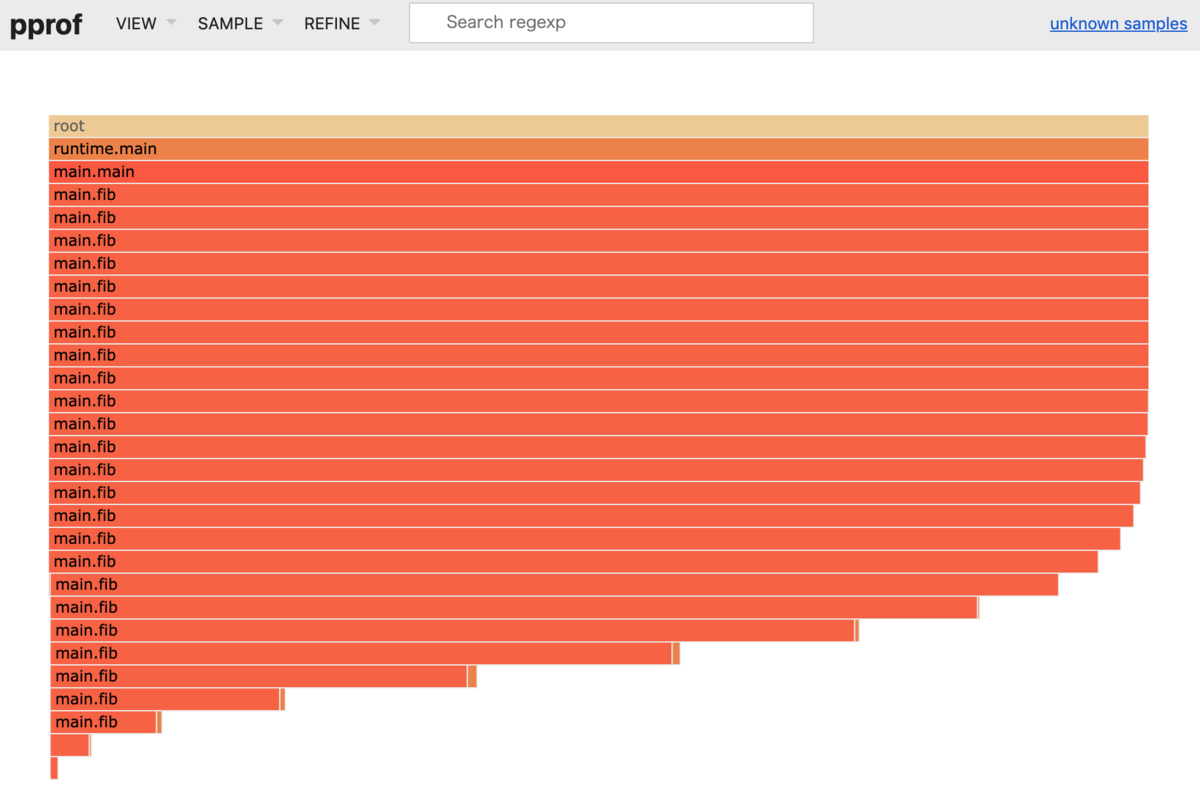
このようなグラフが表示されます。

どこにどれくらいCPU使用時間がかかっているかのFlame Graphもあります。
profileのところを前述の別リソースにすれば
$ go tool pprof -http=":8081" http://localhost:6060/debug/pprof/heap
それ用のWebUIが提供されます。

まとめ
pprofの基本的な使い方を説明しました。
次回はCPUの詳細や、heapなどを扱っていきたいと思います。