概要
前回はHTTPのAPIサーバの監視の仕方を説明しました。
今回はgRPCでのメトリクスの作り方を説明します。
環境
- Prometheus 2.11.1
- Golang 1.12.7
- Grafana 6.2.5
- prometheus/client_golang 1.0.0
- go-grpc-prometheus 1.2.0
メトリクスの追加
実際の処理をするServer側と、コールするClient側の両方にメトリクスを追加していきます。
サンプルコードは
にあります。
Server
を参考に進めます。
Interceptor
interceptorとして用意されているのでそれを使います。
s := grpc.NewServer(
        grpc.UnaryInterceptor(grpc_prometheus.UnaryServerInterceptor),
)

// Register your gRPC service implementations.
pb.RegisterAliveServiceServer(s, new(aliveService))
pb.RegisterUserServiceServer(s, new(userService))

// After all your registrations, make sure all of the Prometheus metrics are initialized.
grpc_prometheus.Register(s)
expose
PrometheusがPullできるよう、HTTPエンドポイントを用意します。
mux := http.NewServeMux()
// Enable histogram
grpc_prometheus.EnableHandlingTimeHistogram()
mux.Handle("/metrics", promhttp.Handler())
go func() {
       fmt.Println("Prometheus metrics bind address", promAddr)
       log.Fatal(http.ListenAndServe(promAddr, mux))
}()
DurationのメトリクスもほしいのでEnableHandlingTimeHistogram()を呼んでいます。
Client
を参考に進めます。
Interceptor
Client側もinterceptorがあるので利用します。
mux := runtime.NewServeMux(opts...)
dialOpts := []grpc.DialOption{
        grpc.WithInsecure(),
        grpc.WithUnaryInterceptor(grpc_prometheus.UnaryClientInterceptor),
}

fmt.Println("Backend endpoint: ", endpoint)
conn, err := grpc.Dial(endpoint, dialOpts...)
if err != nil {
        return nil, err
}
err = pb.RegisterAliveServiceHandler(ctx, mux, conn)
if err != nil {
        return nil, err
}
err = pb.RegisterUserServiceHandler(ctx, mux, conn)
if err != nil {
        return nil, err
}

return mux, nil
expose
同じくPrometheusがPullするHTTPエンドポイントを用意します。
mux := http.NewServeMux()
// Enable histogram
grpc_prometheus.EnableClientHandlingTimeHistogram()
mux.Handle("/metrics", promhttp.Handler())
go func() {
        fmt.Println("Prometheus metrics bind address:", promAddr)
        log.Fatal(http.ListenAndServe(promAddr, mux))
}()
こちらもDurationのメトリクスがほしいのでEnableClientHandlingTimeHistogram()をコールします。
時系列データを溜める
今回はvegetaを利用します。rpsベースで負荷をかけられるため、負荷とメトリクスの比較がしやすいです。
/alive
$ echo "GET http://localhost:8080/alive" | vegeta attack -rate=40 -duration=60s
/user
$ echo "GET http://localhost:8080/user" | vegeta attack -rate=30 -duration=60s
/user/alice
$ echo "GET http://localhost:8080/user/alice" | vegeta attack -rate=20 -duration=60s
Grafanaで可視化
Prometheus でAPIサーバの監視【HTTP】 - Carpe Diem
で詳しく説明しているので、今回は簡単に説明します。
テンプレート変数
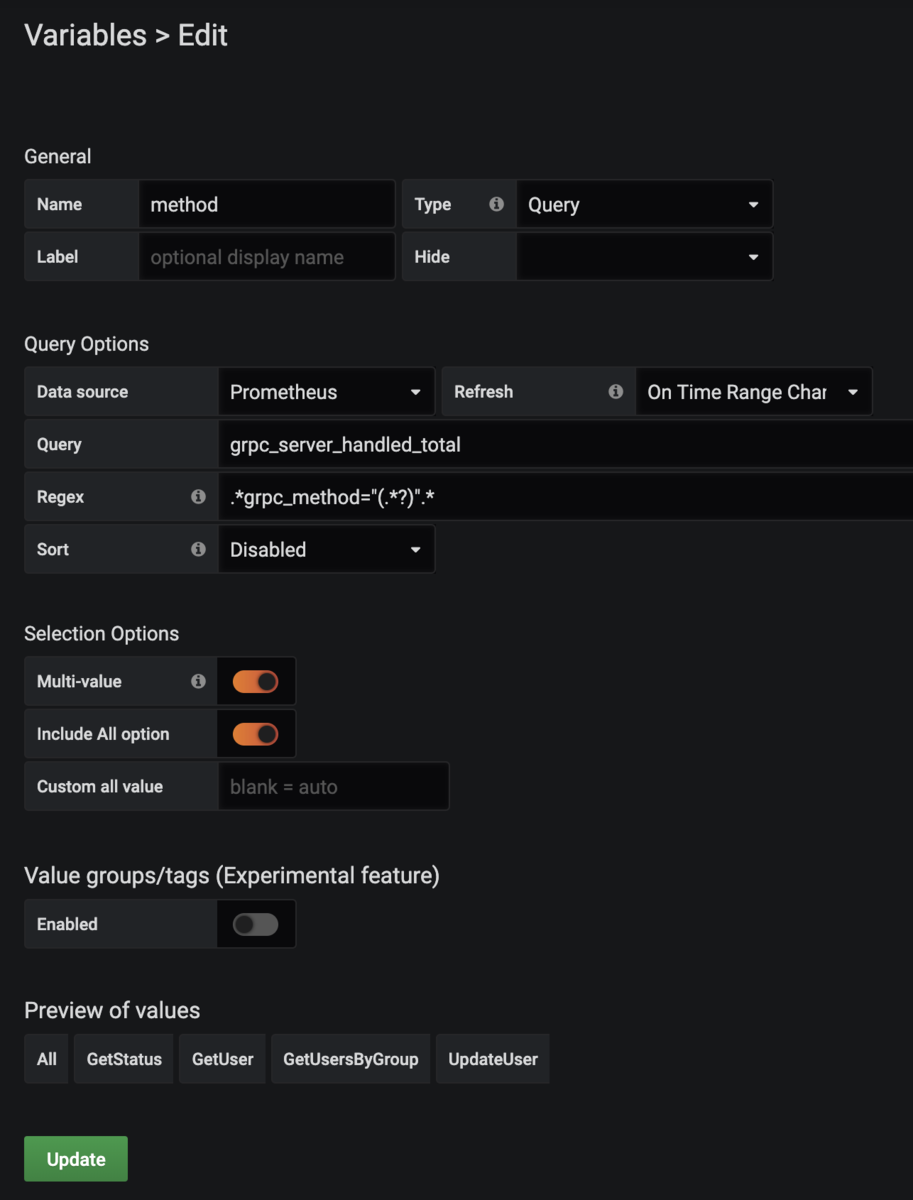
メソッド毎に出し分けられるようなテンプレート変数を用意してみます。

今回Multi-valueを使っていますが、これは正規表現で表されるため、PromQLでは=~を使います。
Rate
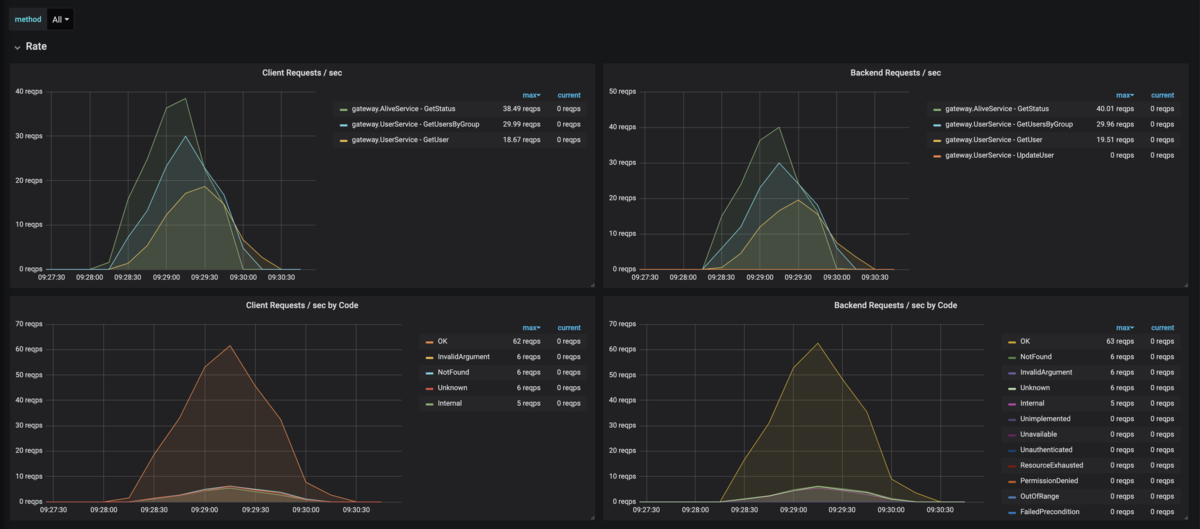
直近1分間の秒間リクエスト数を可視化します。
PromQL(Client)
sum by(grpc_method,grpc_service)(rate(grpc_client_handled_total{grpc_method=~"$method"}[1m]))
Code毎は以下のように設定します。
sum by(grpc_code)(rate(grpc_client_handled_total{grpc_method=~"$method"}[1m]))
PromQL(Server)
sum by(grpc_method,grpc_service)(rate(grpc_server_handled_total{grpc_method=~"$method"}[1m]))
Code毎は以下のように設定します。
sum by(grpc_code)(rate(grpc_server_handled_total{grpc_method=~"$method"}[1m]))
グラフ
左がクライアント、右がサーバです。

Errors
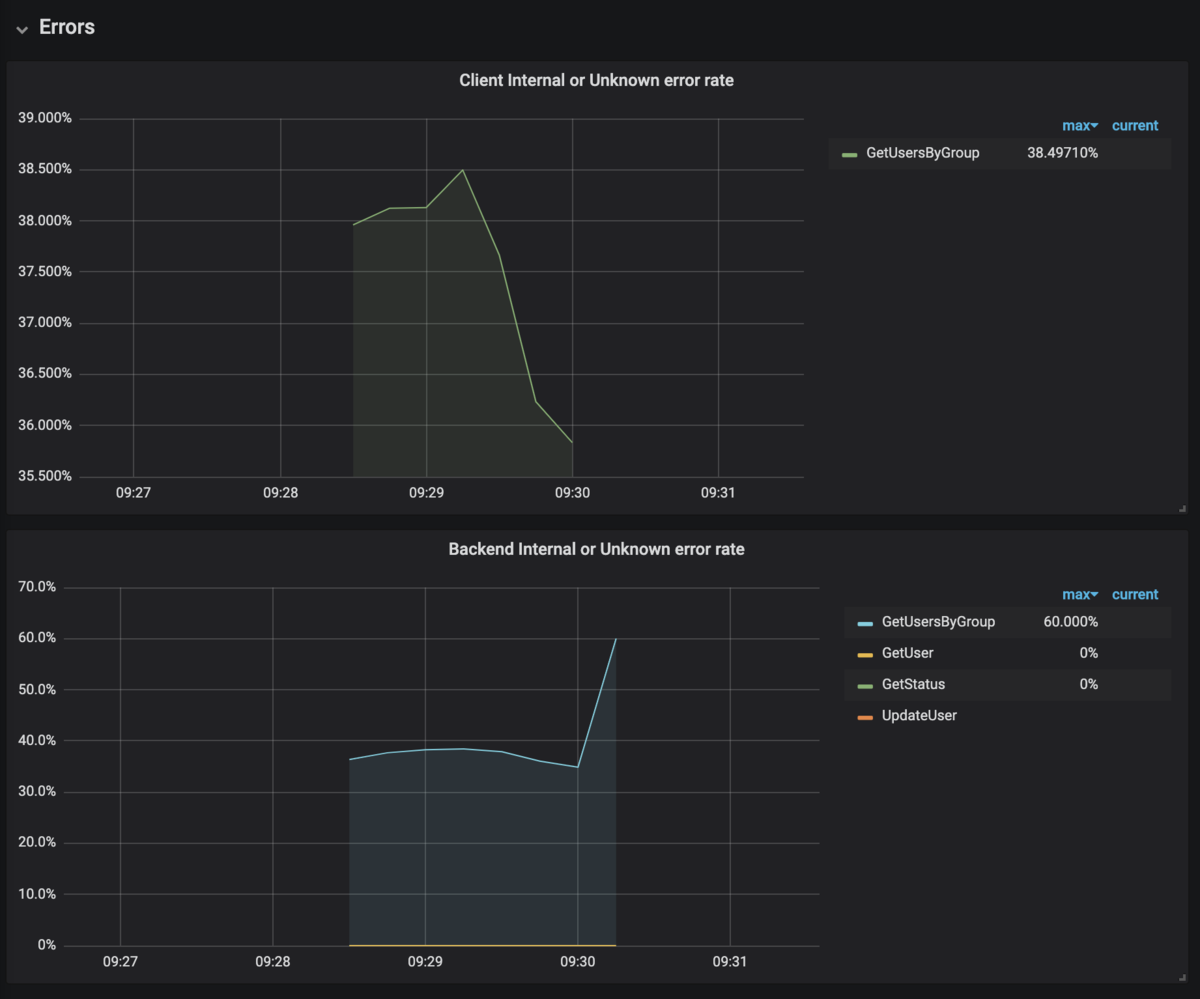
Internal, Unknownを抽出します。
PromQL(Client)
sum by(grpc_method)(rate(grpc_client_handled_total{grpc_code=~"(Unknown|Internal)",grpc_method=~"$method"}[1m]))
/
sum by(grpc_method)(rate(grpc_client_handled_total{grpc_method=~"$method"}[1m]))
PromQL(Server)
sum by(grpc_method)(rate(grpc_server_handled_total{grpc_code=~"(Unknown|Internal)",grpc_method=~"$method"}[1m]))
/
sum by(grpc_method)(rate(grpc_server_handled_total{grpc_method=~"$method"}[1m]))
グラフ
上がクライアント、下がサーバです。

Duration
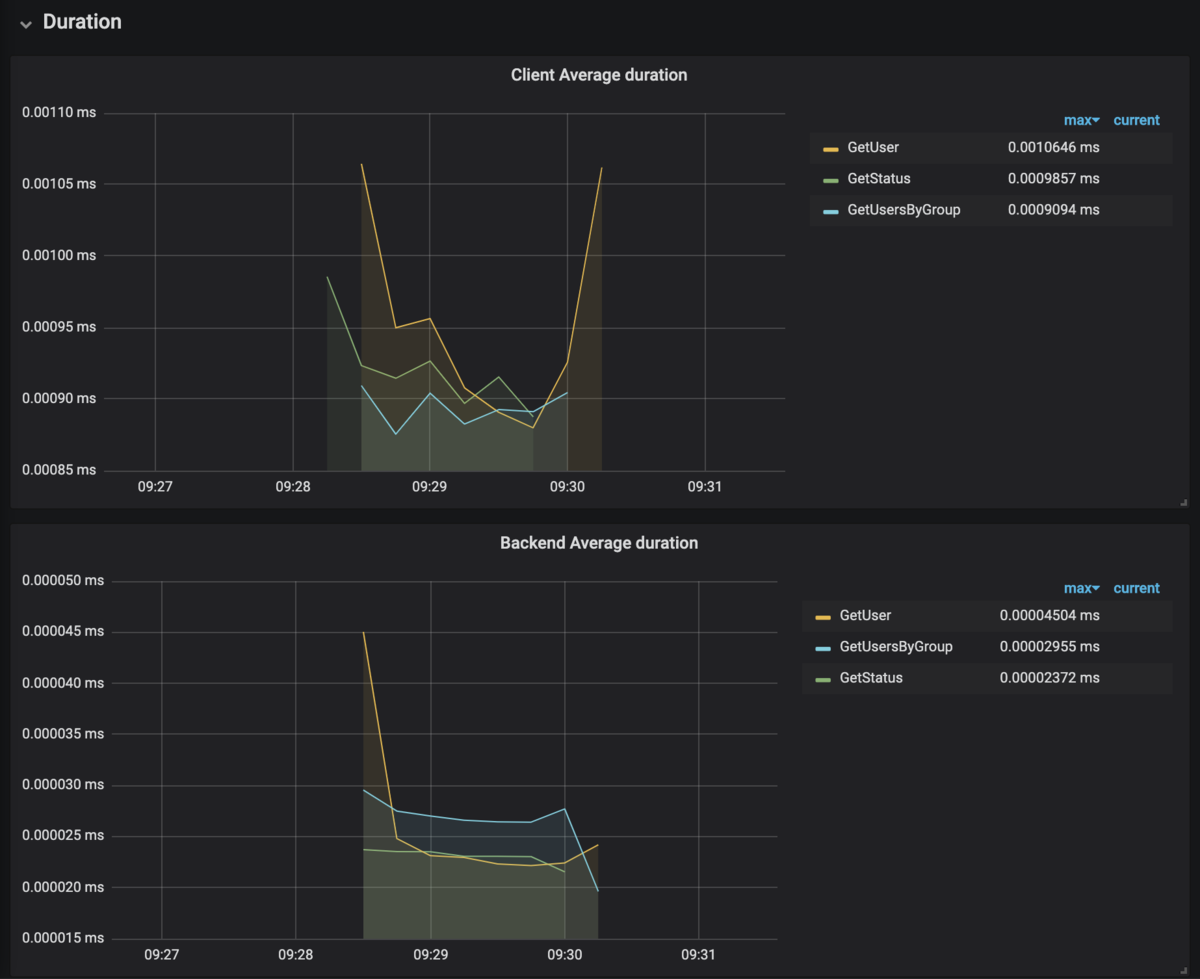
平均Latencyを出します。
PromQL(Client)
rate(grpc_client_handling_seconds_sum{grpc_method=~"$method"}[1m])
/
rate(grpc_client_handling_seconds_count{grpc_method=~"$method"}[1m])
PromQL(Server)
rate(grpc_server_handling_seconds_sum{grpc_method=~"$method"}[1m])
/
rate(grpc_server_handling_seconds_count{grpc_method=~"$method"}[1m])
グラフ
上がクライアント、下がサーバです。
TCP経由なのでクライアントの方が断然数値が大きいですね。

まとめ
gRPCのメトリクスを取得し、各メソッドのRED要素を可視化できるようにしました。
各クライアント、各gRPC毎に可視化することで問題点が非常に把握しやすくなりますね。