概要
前回は既存のexporterを利用せず、自分でメトリクスを生成する方法を説明しました。
その方法を使って実際にAPIサーバ(HTTP)のメトリクスを生成し、可視化してみます。
環境
The Four Golden SignalsとREDメソッド
分散システムで何をモニタリングすべきかについては、The Four Golden Signalsが有名です。
それを踏まえてマイクロサービスではREDメソッドという指標があります。
| 項目 | 説明 |
|---|---|
| Rate | リクエスト数/sec |
| Errors | エラー数 |
| Duration | リクエスト毎のduration |
今回はこのREDメソッドに基づいて可視化できるようにします。
メトリクスの追加
のメトリクスが取れれば基本的に可視化したいものは出せそうです。
コレクタ
を取得できるようにするためのコレクタを用意します。
inFlight = prometheus.NewGauge(prometheus.GaugeOpts{
        Name: "http_requests_in_flight",
        Help: "A gauge of requests currently being served by the wrapped handler.",
})

counter = prometheus.NewCounterVec(
        prometheus.CounterOpts{
                Name: "http_requests_total",
                Help: "A counter for requests to the wrapped handler.",
        },
        []string{"handler", "code", "method"},
)

duration = prometheus.NewHistogramVec(
        prometheus.HistogramOpts{
                Name:    "request_duration_seconds",
                Help:    "A histogram of latencies for requests.",
                Buckets: []float64{.25, .5, 1, 2.5, 5, 10},
        },
        []string{"handler", "method"},
)

responseSize = prometheus.NewHistogramVec(
        prometheus.HistogramOpts{
                Name:    "response_size_bytes",
                Help:    "A histogram of response sizes for requests.",
                Buckets: []float64{200, 500, 900, 1500},
        },
        []string{},
)
ヒストグラムバケットは未指定であればDefBucketsが設定されます。
DefBuckets = []float64{.005, .01, .025, .05, .1, .25, .5, 1, 2.5, 5, 10}
これは秒単位のDuration(レイテンシ)で一般的に使われる値になっています。
ミドルウェア
promhttpにはメトリクスが簡単に取得できるようあらかじめミドルウェアが用意されています。
今回使うのは以下の4つです。
| ミドルウェア | 役割 | 備考 |
|---|---|---|
| InstrumentHandlerInFlight | 現在処理中のリクエスト数 | - |
| InstrumentHandlerDuration | latencycode, methodのラベルが用意されている |
handler毎でも分類したいのでhandlerラベルをコレクタに追加 |
| InstrumentHandlerCounter | リクエスト数code, methodのラベルが用意されている |
handler毎でも分類したいのでhandlerラベルをコレクタに追加 |
| InstrumentHandlerResponseSize | レスポンスサイズcode, methodのラベルが用意されている |
- |
ミドルウェアチェーンとしてセットできるので、共通関数を用意しておきます。
func genInstrumentChain(name string, handler http.HandlerFunc) http.Handler {
        return promhttp.InstrumentHandlerInFlight(inFlight,
                promhttp.InstrumentHandlerDuration(duration.MustCurryWith(prometheus.Labels{"handler": name}),
                        promhttp.InstrumentHandlerCounter(counter.MustCurryWith(prometheus.Labels{"handler": name}),
                                promhttp.InstrumentHandlerResponseSize(responseSize, handler),
                        ),
                ),
        )
}
handler
- alive
- hello
という2つのhandlerを用意します。
エラーレートも可視化したいのでランダムでエラーを返すようにしています。
func alive(w http.ResponseWriter, _ *http.Request) {
        dur := rand.Intn(1000)
        time.Sleep(time.Duration(dur) * time.Millisecond)  // 処理を表現するためのsleep
        w.WriteHeader(http.StatusOK)
        fmt.Fprintln(w, "OK")
}

func hello(w http.ResponseWriter, _ *http.Request) {
        dur := rand.Intn(1000)
        time.Sleep(time.Duration(dur) * time.Millisecond)  // 処理を表現するためのsleep
        n := rand.Intn(4)  // エラーレスポンスを返すためのランダム値
        switch n {
        case 0:
                w.WriteHeader(http.StatusOK)
                fmt.Fprintln(w, "Hello World")
        case 1:
                w.WriteHeader(http.StatusNotFound)
                fmt.Fprintln(w, "Not Found")
        case 2:
                w.WriteHeader(http.StatusBadRequest)
                fmt.Fprintln(w, "Bad Request")
        case 3:
                w.WriteHeader(http.StatusInternalServerError)
                fmt.Fprintln(w, "Internal Server Error")
        }
}
main
コレクタの登録やhandlerの登録をして/metricsにてexposeします。
func init() {
        prometheus.MustRegister(inFlight, counter, duration, responseSize)
}

func main() {
        aliveChain := genInstrumentChain("alive", alive)
        helloChain := genInstrumentChain("hello", hello)

        http.Handle("/metrics", promhttp.Handler())

        http.Handle("/", aliveChain)
        http.Handle("/hello", helloChain)
        log.Fatal(http.ListenAndServe(":8080", nil))
}
時系列データを溜める
abで適当にリクエストを投げて時系列データを溜めていきます。
alive handler
$ ab -n 10000 -c 10 localhost:8080/
hello handler
$ ab -n 10000 -c 10 localhost:8080/hello
POSTリクエスト
$ ab -n 10000 -c 10 -p hoge.json localhost:8080/hello
PUTリクエスト
$ ab -n 10000 -c 10 -u hoge.json localhost:8080/hello
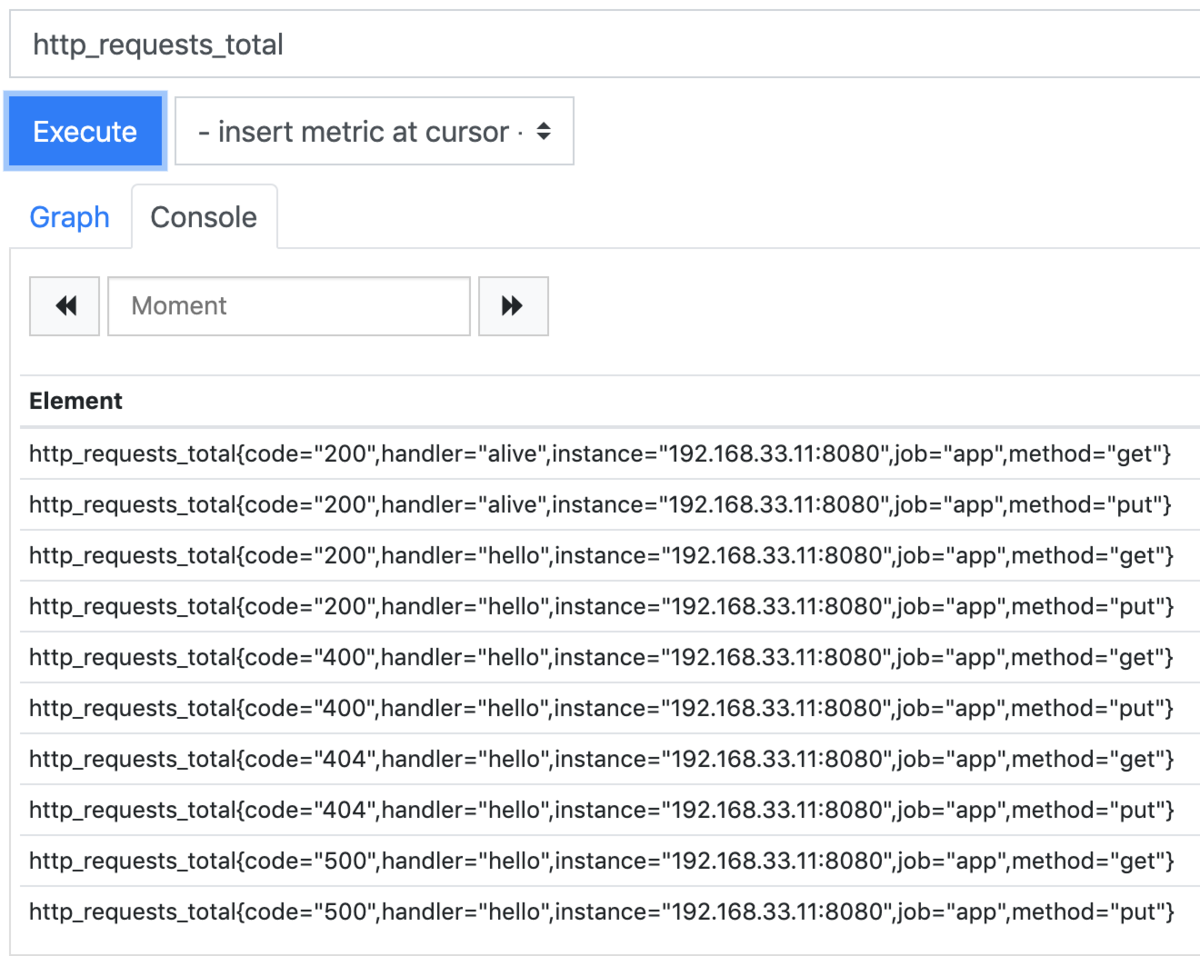
各ラベルでメトリクスが生成されるので以下のようになります。
Grafanaで可視化
先程実装したメトリクスをGrafanaで可視化します。
Rate
直近1分間の秒間リクエスト数を可視化します。
handler毎
handlerとmethodで分類できるようにします。
PromQL
sum by(handler, method)(rate(http_requests_total[1m]))
と書きます。
rate(http_requests_total[1m]
だけだとcodeラベルによってstatus code毎にメトリクスがあるため凡例が増えてしまいます。
なのでhandlerとmethodでグルーピングします。
codeをまとめたいだけなので
sum without(code)(rate(http_requests_total[1m]))
でも同じ結果を出せます。
Grafana設定
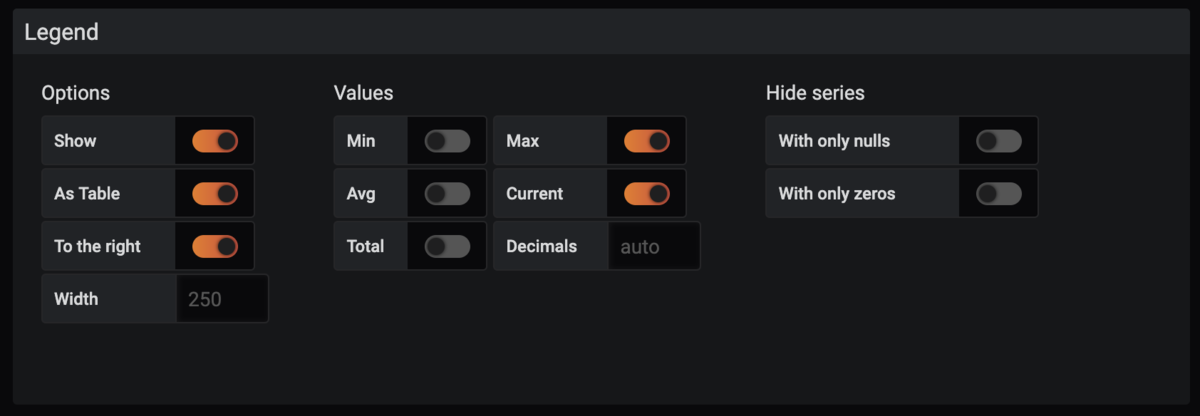
QueryとLegendを設定します。
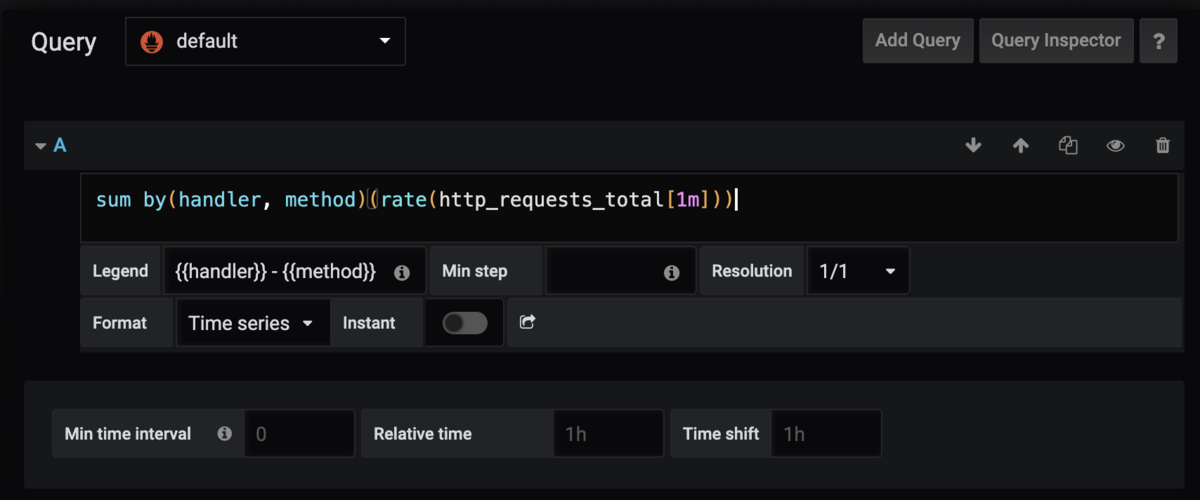
VisualizationはAxesのUnitをrpsにし、
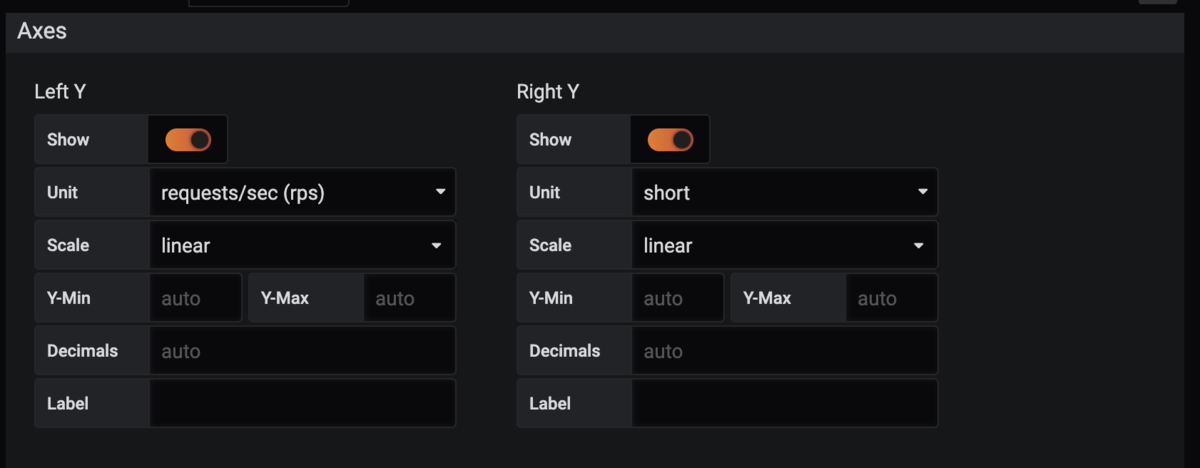
Legendの表示設定をいじります。
結果以下のように表示されます。

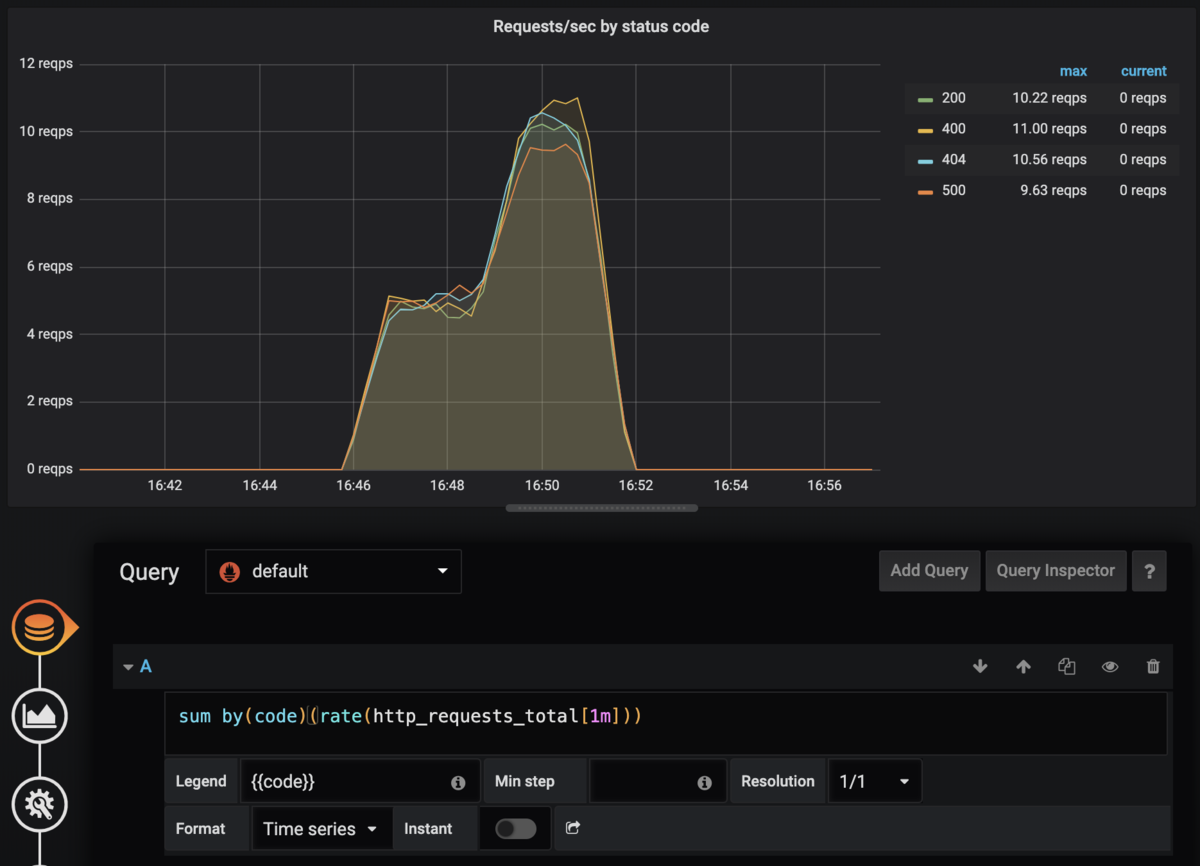
HTTP status毎
HTTP status codeで分類します。
PromQL
sum by(code)(rate(http_requests_total[1m]))
今度はcodeラベルでグルーピングしてます。
Grafana設定
先程と同じように設定します。
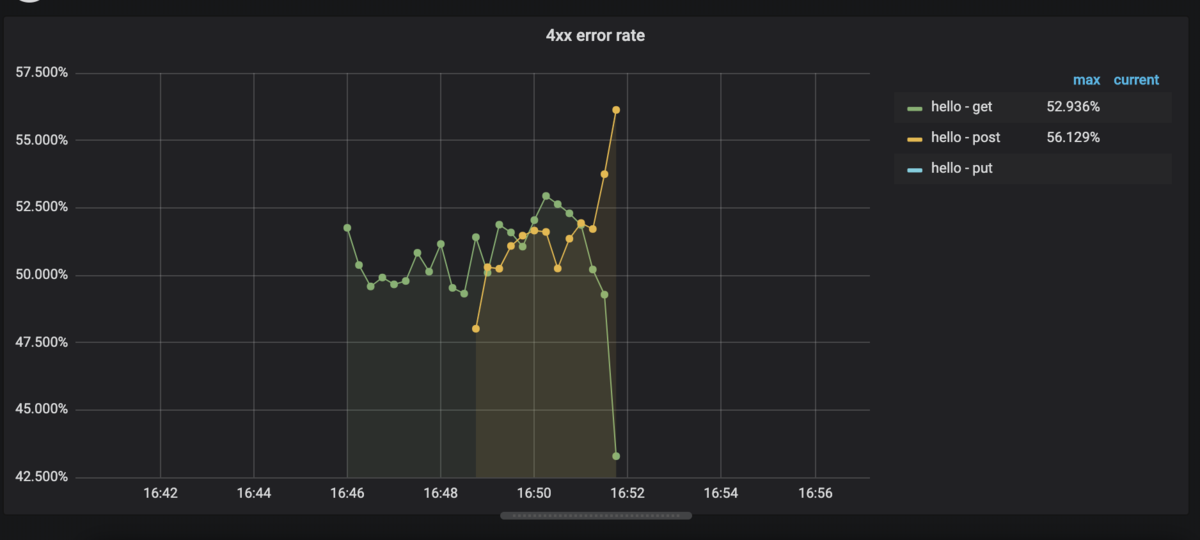
Errors
handler毎に4xxエラー・5xxエラーの%を可視化します。
4xxエラー
PromQL
sum by(handler, method)(rate(http_requests_total{code=~"4.."}[1m]))
/
sum by(handler, method)(rate(http_requests_total[1m]))
と書きます。http_requests_total{code=~"4.."}で正規表現一致をさせてます。
単純に
rate(http_requests_total{code=~"4.."}[1m])
/
rate(http_requests_total[1m])
だとベクトルがマッチするもの(=分子も分母もcode="4xx")同士で割り算してしまうので常に1になってしまいます。
なのでcodeを無視したグルーピングが必要です。
by()ではなくwithout()を使って
sum without(code)(rate(http_requests_total{code=~"4.."}[1m]))
/
sum without(code)(rate(http_requests_total[1m]))
でも同じ結果になります。
Grafana設定
QueryとLegendを設定し、

AxesのUnitを%にします。

これで以下のように表示されます。
5xxエラー
PromQL
sum by(handler, method)(rate(http_requests_total{code=~"5.."}[1m]))
/
sum by(handler, method)(rate(http_requests_total[1m]))
とします。正規表現のパターンだけの変更です。
Grafana設定
先程と同様に設定します。

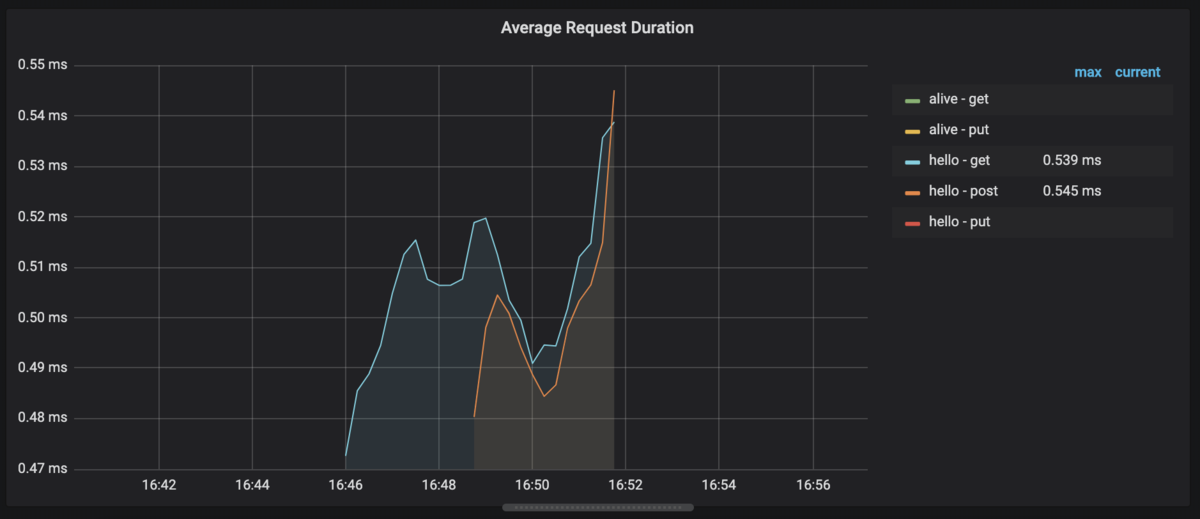
Duration
handler毎に平均duration, 50%ile, 90%ileを可視化します。
Average
PromQL
rate(request_duration_seconds_sum[1m])
/
rate(request_duration_seconds_count[1m])
サマリコレクタでやったように平均値を出します。
Grafana設定
QueryとLegendを設定し、

コレクタには秒単位でデータを渡しているのでAxesのUnitを秒に。
※図では間違ってミリ秒になってます
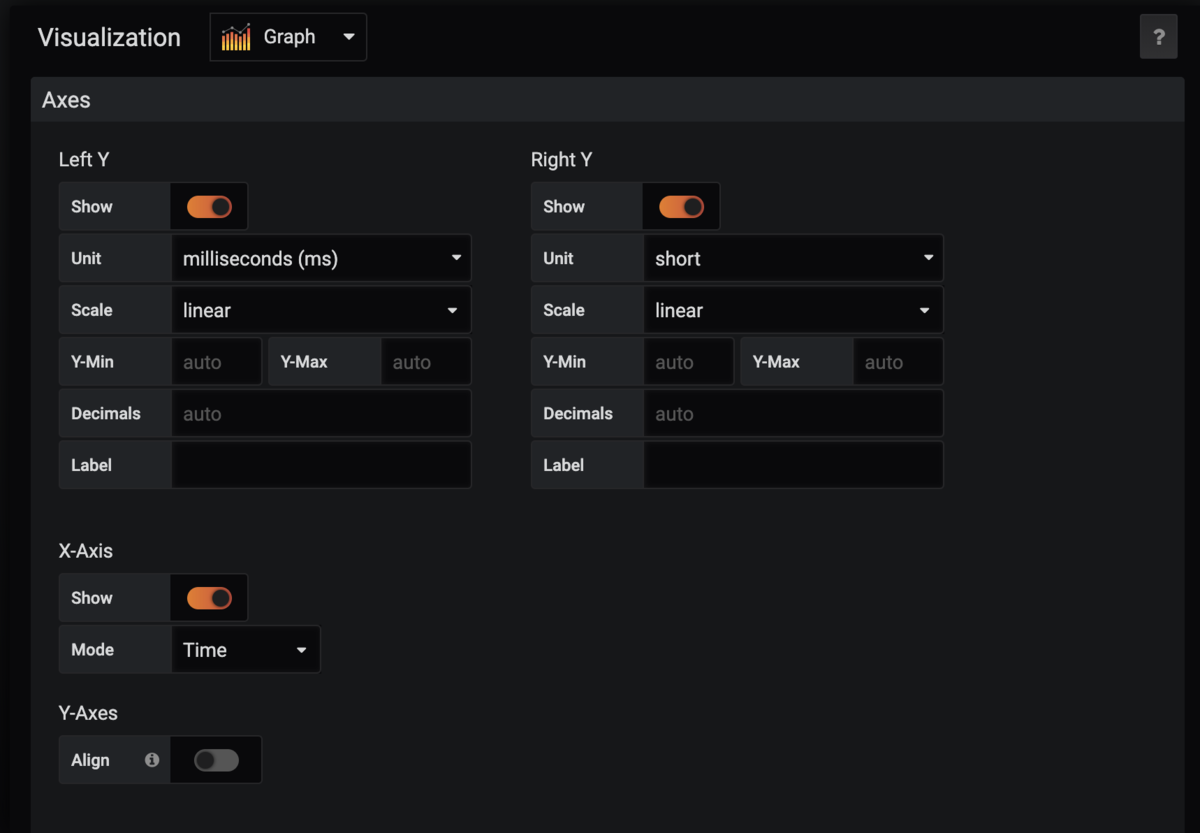
すると以下のように表示されます。
Percentile
duration 50%ileと90%ileを可視化します。
ほぼ同じなので50%ileのみ説明します。
PromQL
ヒストグラムコレクタでやったようにhistogram_quantile()を使います。
histogram_quantile(0.5, rate(request_duration_seconds_bucket[1m]))
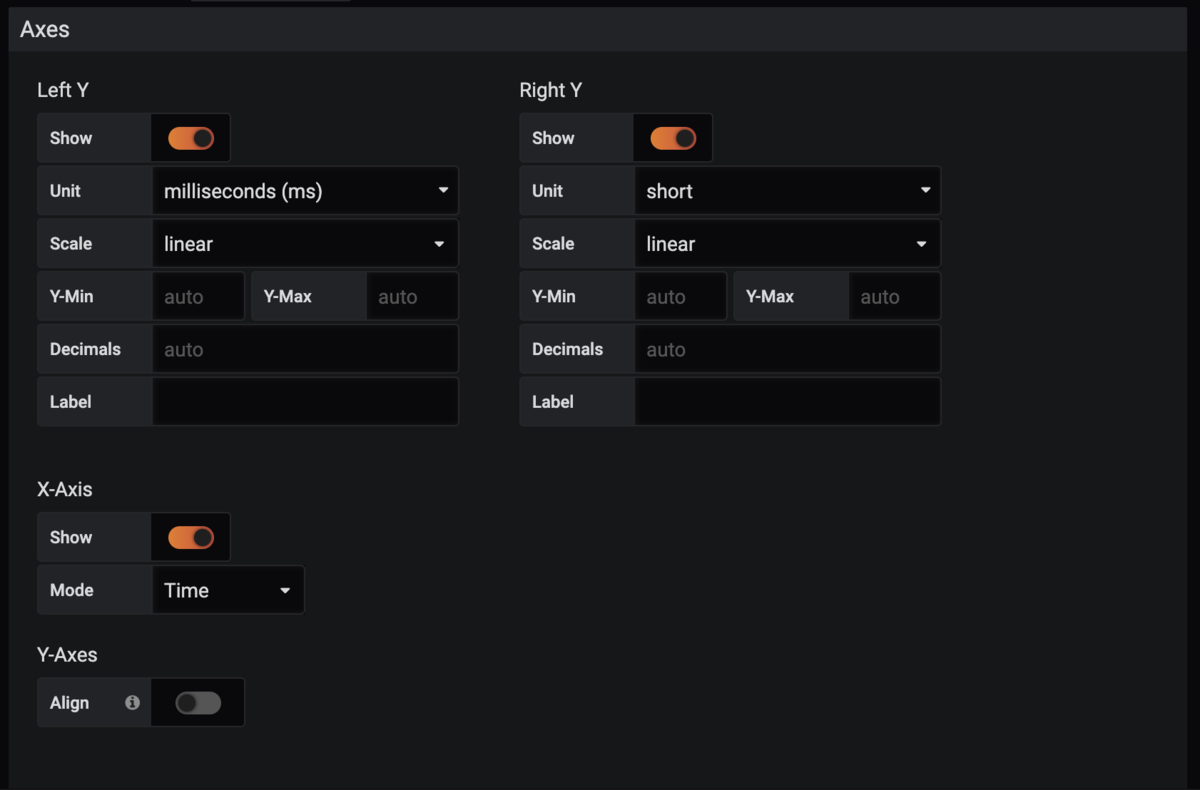
Grafana設定
QueryとLegendを設定し、
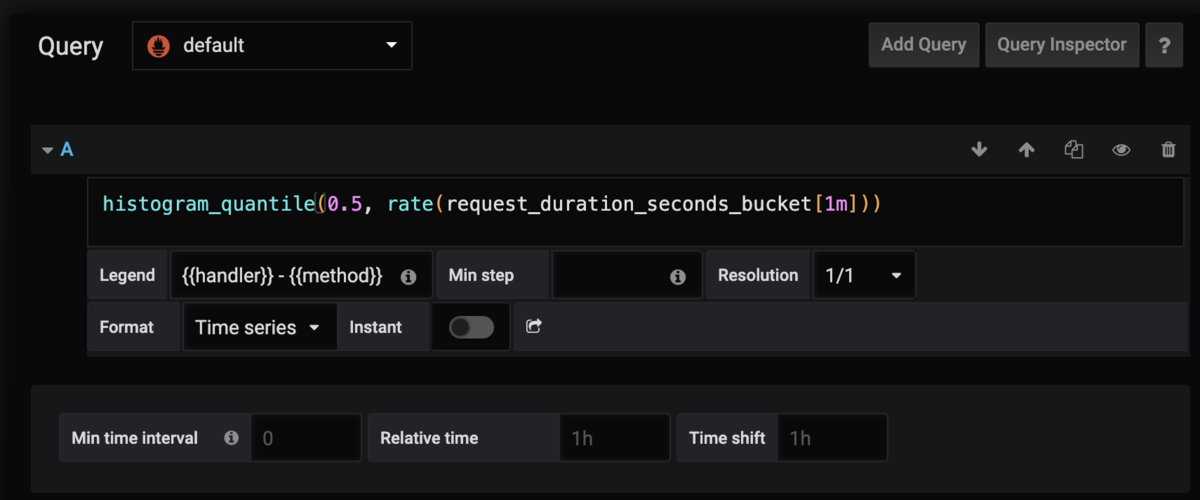
コレクタには秒単位でデータを渡しているのでAxesのUnitを秒に。
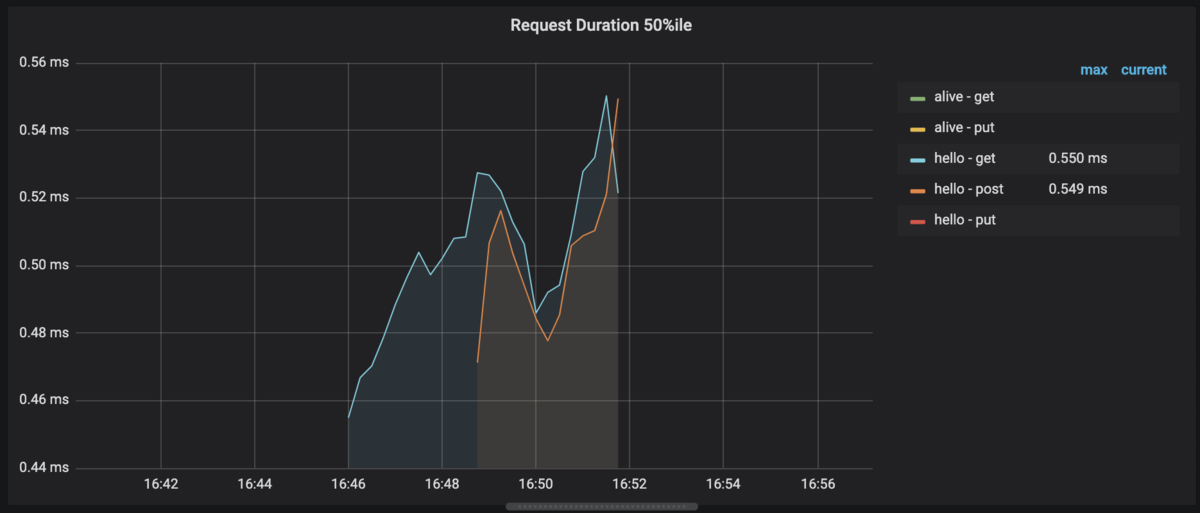
※図では間違ってミリ秒になってます
すると以下のように表示されます。
最終的なダッシュボード
それぞれをまとめると以下のように表示されます。

サンプルコード
今回使用したコードはこちらです。
まとめ
独自メトリクスを用いてREDメソッドに基づく要素を可視化しました。
試した感想としてはPrometheusにメトリクスさえ保存してしまえばGrafanaでかなり柔軟に可視化できると思いました。
次回はgRPCのメトリクスを可視化してみます。